
HELP / ANALYTICS & API
Read your Analyze report
Views, engagement and revenue — what each number means and which ones actually matter.
1 MIN READ
The Stats section opens the Analyze report: the path from someone seeing a testimonial to someone buying. Switch between 7, 30 and 90 days at the top, and export any view as CSV.
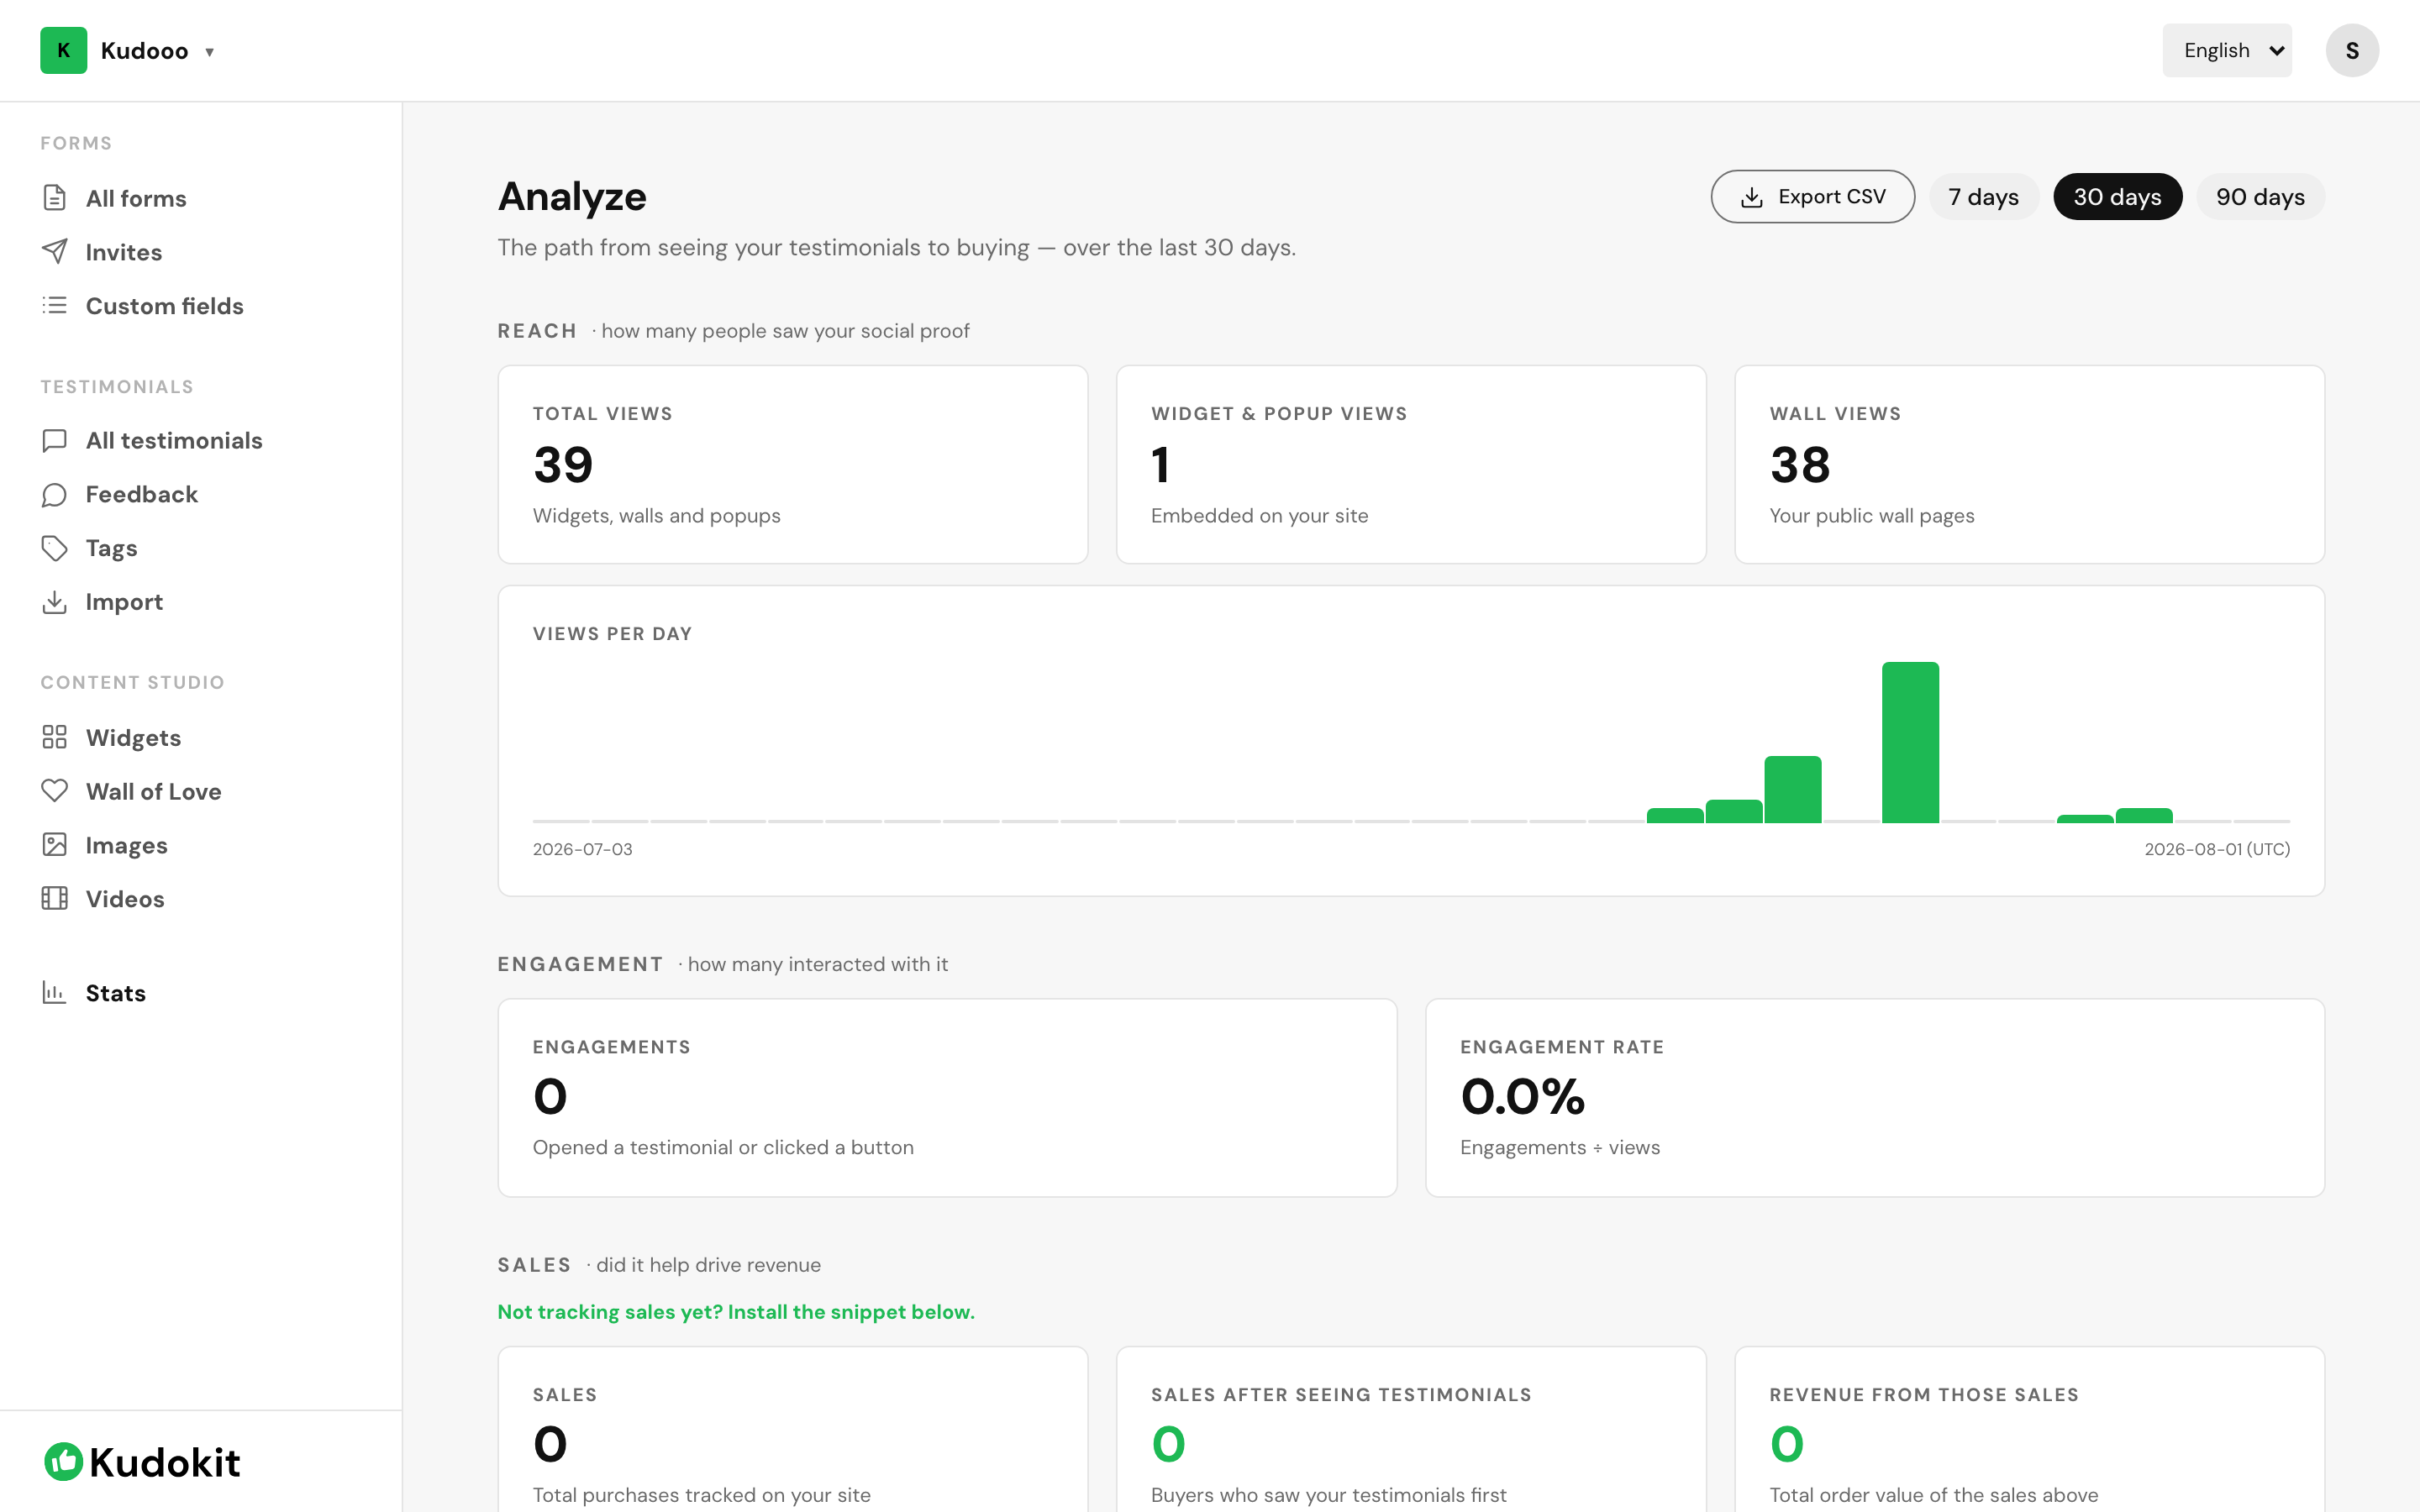
Reach — how many people saw your social proof
- Total views — widgets, walls and popups combined.
- Widget & popup views — the ones embedded on your site.
- Wall views — your public wall pages.
Views per day shows the shape over time, which matters more than the total. A flat line after a campaign means the placement is not in a path people walk.
Engagement — how many interacted
Engagements counts people who opened a testimonial or clicked a button; engagement rate is engagements ÷ views. High views with near-zero engagement usually means the widget is below where people stop reading, not that the testimonials are bad.
Sales — did it drive revenue
Three figures: total purchases tracked, how many of those buyers saw a testimonial first, and the order value of those sales. This requires installing a tracking snippet — until you do, the section prompts you to add it and the numbers stay at zero.
Revenue attribution needs Starter or Pro.
Related
Support
Still stuck? Email support.
A human replies — usually within a few hours.